If you run a SaaS help center, you’ve probably felt this: tickets keep coming in, your team is stretched thin, and leadership wants proof that your knowledge base is “working.” You’ve added articles, maybe even improved search—but when it comes to which knowledge base metrics actually matter, things get fuzzy fast.
This guide cuts through the noise. We’ll break down the handful of knowledge base KPIs that truly impact ticket reduction, show how to measure them, and explain how to turn insights into fewer support requests—without overcomplicating your workflow.
Why Knowledge Base Metrics Matter (More Than You Think)
Most support teams track something—page views, maybe article likes—but those don’t always tie back to real outcomes.
What leadership cares about:
- Fewer tickets
- Faster resolutions
- Lower support costs
That’s where knowledge base analytics come in. When you focus on the right metrics, your help center becomes more than documentation—it becomes a ticket-deflection engine.
Stat to know: Zendesk reports that just 4–7 well-optimized articles can reduce tickets by 20%+
That’s not about volume—it’s about targeting the right content and measuring its impact.
The Core Knowledge Base Metrics You Should Track
Not all metrics are created equal. These are the ones that directly connect to support performance and ROI.
1. Ticket-Deflection Rate
What it is: The percentage of users who find answers in your knowledge base instead of contacting support.
Why it matters: This is the clearest indicator that your help center is actually working.
How to think about it: If 1,000 users visit your help center and 200 submit tickets, your deflection rate is tied to how many didn’t need help afterward.
2. Article Effectiveness Score
What it is: A measure of whether an article actually helps users solve their problem.
This can include:
- “Was this helpful?” votes
- Time spent on page
- Exit without searching again
Why it matters: An article with high views but low effectiveness is hurting your support team.
- High traffic
- Low helpfulness ratings
Update those first—they’re your biggest quick wins.
3. Search Success Rate
What it is: How often users find what they’re looking for after searching.
Why it matters: Search is the front door of your knowledge base. If it fails, tickets rise.
How to spot issues:
- High search volume + repeated queries
- Users searching multiple times
- Searches that lead to no clicks
According to Helpjuice’s guide on leveraging knowledge base metrics, tracking search queries and analytics is one of the most effective ways to identify content gaps and improve your help center.
4. Top Content by Traffic (and What It Means)
What it is: Your most-viewed articles.
Why it matters: These represent your most common customer problems.
- Does it reduce tickets?
- Can it be clearer?
- Should this problem be fixed in-product instead?
5. Time to Resolution (With and Without the Knowledge Base)
What it is: How long it takes to solve customer issues.
Why it matters: A strong knowledge base reduces resolution time—even when tickets still happen.
What to compare:
- Tickets with article links vs. without
- Self-serve vs. assisted support
6. Content Gap Rate
What it is: How often users look for answers that don’t exist yet.
Signals include:
- Unsuccessful searches
- Repeated support tickets on the same topic
- Low coverage of key product features
Why it matters: Every gap is a future ticket waiting to happen.
How to Turn Metrics Into Fewer Support Tickets
Tracking metrics is only step one. The real value comes from acting on them.
Build a Simple Optimization Loop
Here’s a practical workflow you can run every month:
- Identify high-impact articles
- Update content
- Monitor results
- Repeat
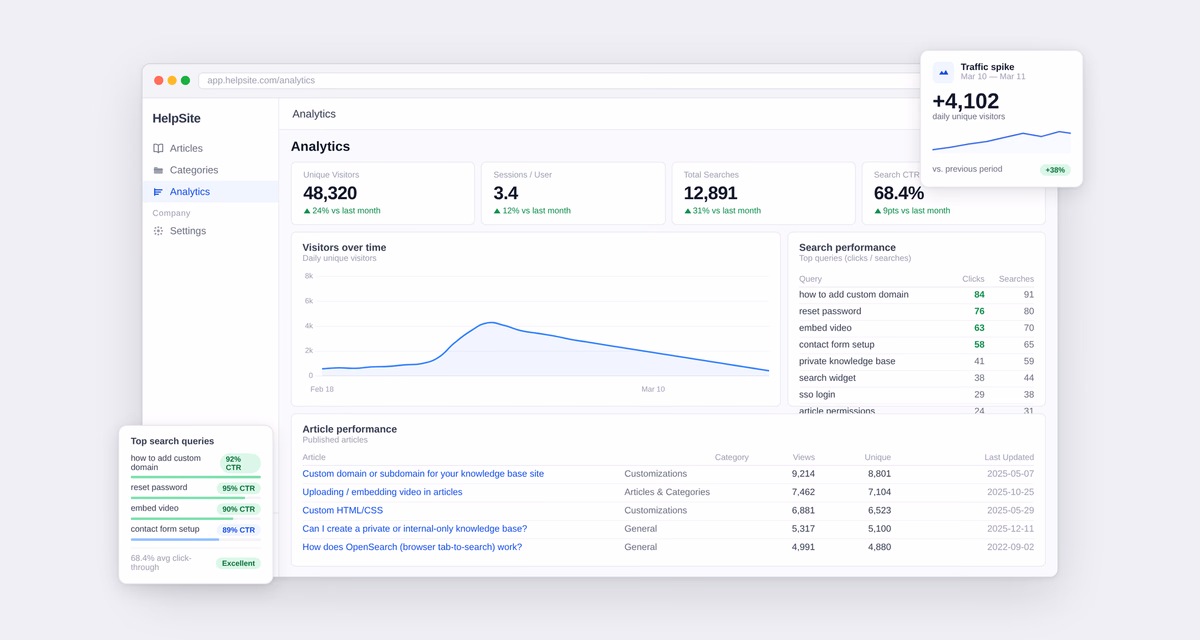
Make it easier with the right tools: Instead of manually pulling data from multiple sources, use a knowledge base with built-in analytics. HelpSite’s dashboard automatically highlights high-traffic, low-performing articles and tracks metrics like ticket-deflection rate and article effectiveness—so you can focus on improving content, not chasing numbers.
👉 Want to track these metrics?Start your HelpSite trial now.
Prioritize Based on Impact, Not Volume
It’s tempting to improve everything—but focus on:
- Articles tied to the most tickets
- Issues affecting onboarding or billing
These areas usually drive the biggest ROI.
Use Support Tickets as Your Content Roadmap
Your support inbox is a goldmine of knowledge base performance insights.
Look for:
- Repeated questions
- Long explanations from agents
- Workarounds that aren’t documented
Common Mistakes When Tracking Knowledge Base KPIs
Even experienced teams fall into these traps.
Mistake 1: Focusing Only on Page Views
Page views are easy to track—but they don’t tell you if users got help.
- Fix: Pair views with deflection and effectiveness.
Mistake 2: Ignoring Search Data
Search data reveals intent. Ignoring it means missing what users actually need.
- Fix: Review search queries weekly.
Mistake 3: Overcomplicating Metrics
Too many dashboards = no action.
Fix: Focus on 4–5 core metrics:
- Ticket-deflection rate
- Article effectiveness
- Search success
- Content gaps
- Top-performing articles
Proving ROI to Leadership
This is where everything comes together.
Leadership doesn’t care about metrics—they care about outcomes.
Tie Metrics to Business Impact
Instead of saying:
Article views increased by 30%
Say:
We reduced support tickets by 18% after optimizing 6 articles
How HelpSite Simplifies Knowledge Base Analytics
Tracking all these metrics manually can get messy fast.
That’s where tools matter.
HelpSite’s built-in analytics dashboard helps you:
- Automatically calculate ticket-deflection rate
- Identify high-traffic, low-performing articles
- Track article effectiveness without extra setup
- Surface content gaps through search insights
Instead of juggling spreadsheets, you get a clear view of your knowledge base performance in one place—so you can focus on improving content, not chasing data.
Final Thoughts on Knowledge Base Metrics
The goal isn’t to track more—it’s to track what actually drives results. When you focus on the right knowledge base metrics, your help center becomes a powerful tool for reducing tickets, improving customer experience, and proving ROI.
Start small:
- Pick 3-5 key metrics
- Optimize a handful of articles
- Measure the impact
You’ll quickly see that even small improvements can lead to meaningful reductions in support load.