See how visitors navigate your content
Track unique visitors and sessions over time to understand traffic patterns and how often people return.
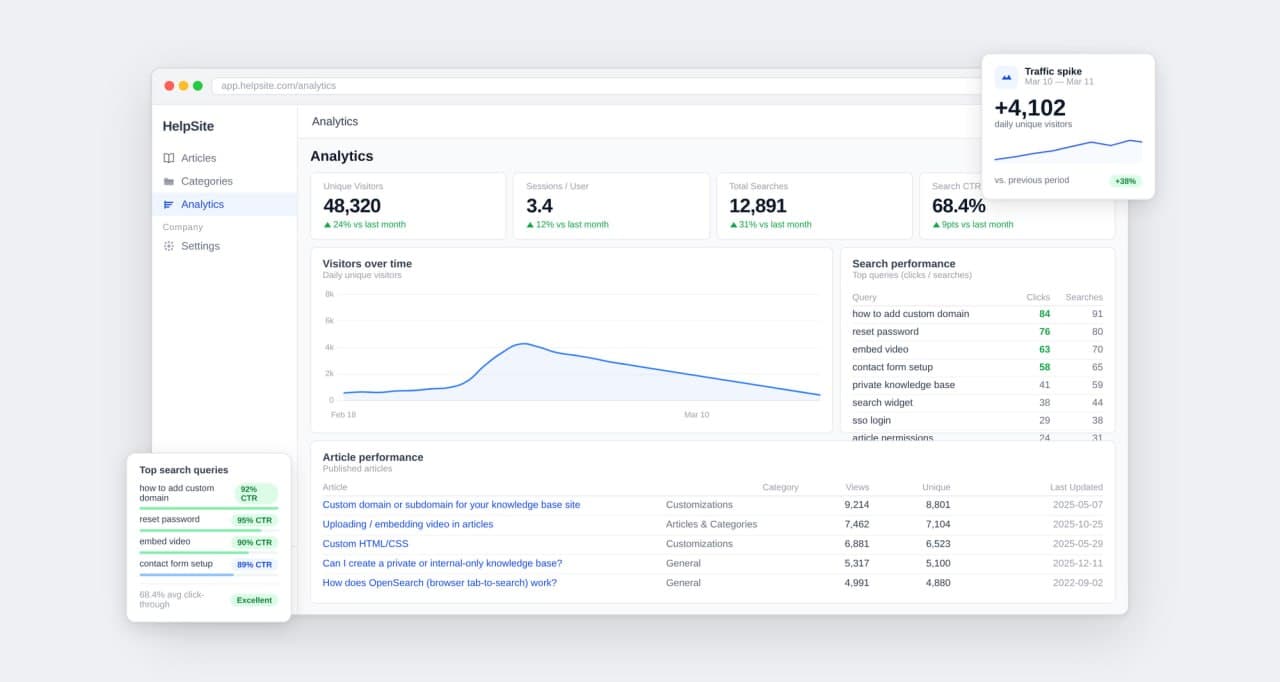
Analytics
Track article performance, search behavior, and traffic trends to build a help center that works harder for your team.
Why it matters
Most teams publish articles and hope for the best. HelpSite Analytics shows you exactly what is happening—so you know what to write, what to update, and what is working.
Track unique visitors and sessions over time to understand traffic patterns and how often people return.
View page views and unique visitors per article so you can see exactly which content is carrying the load.
See what visitors search for and whether they find it. Low click-through searches are your roadmap to new articles.
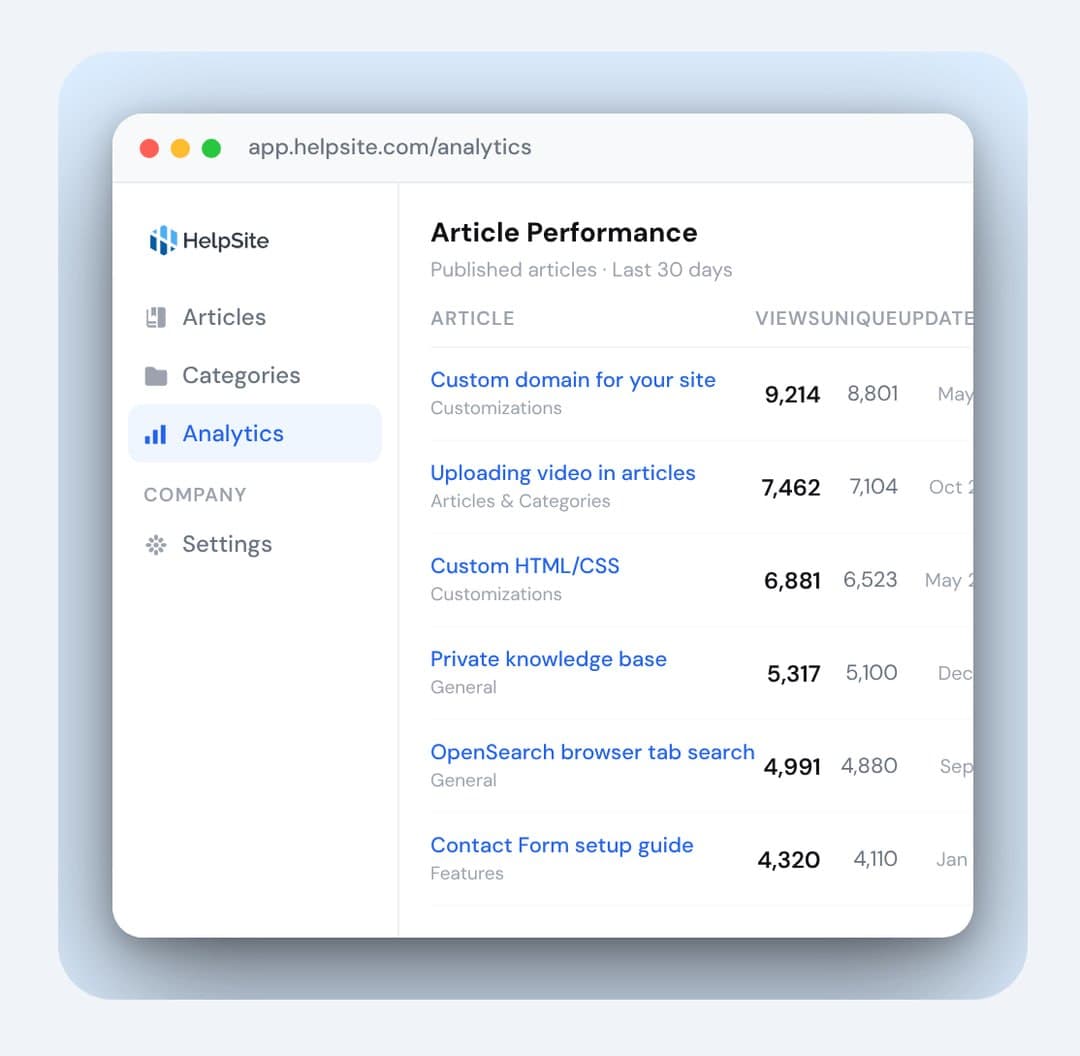
Article performance
Get article-level data that tells you what to keep, what to update, and what to retire.
See how many people land on each article and how many keep coming back.
Order articles by views, unique visitors, or last-updated date to surface what you need fast.
Last-updated timestamps make it easy to find articles that have not been touched in months.
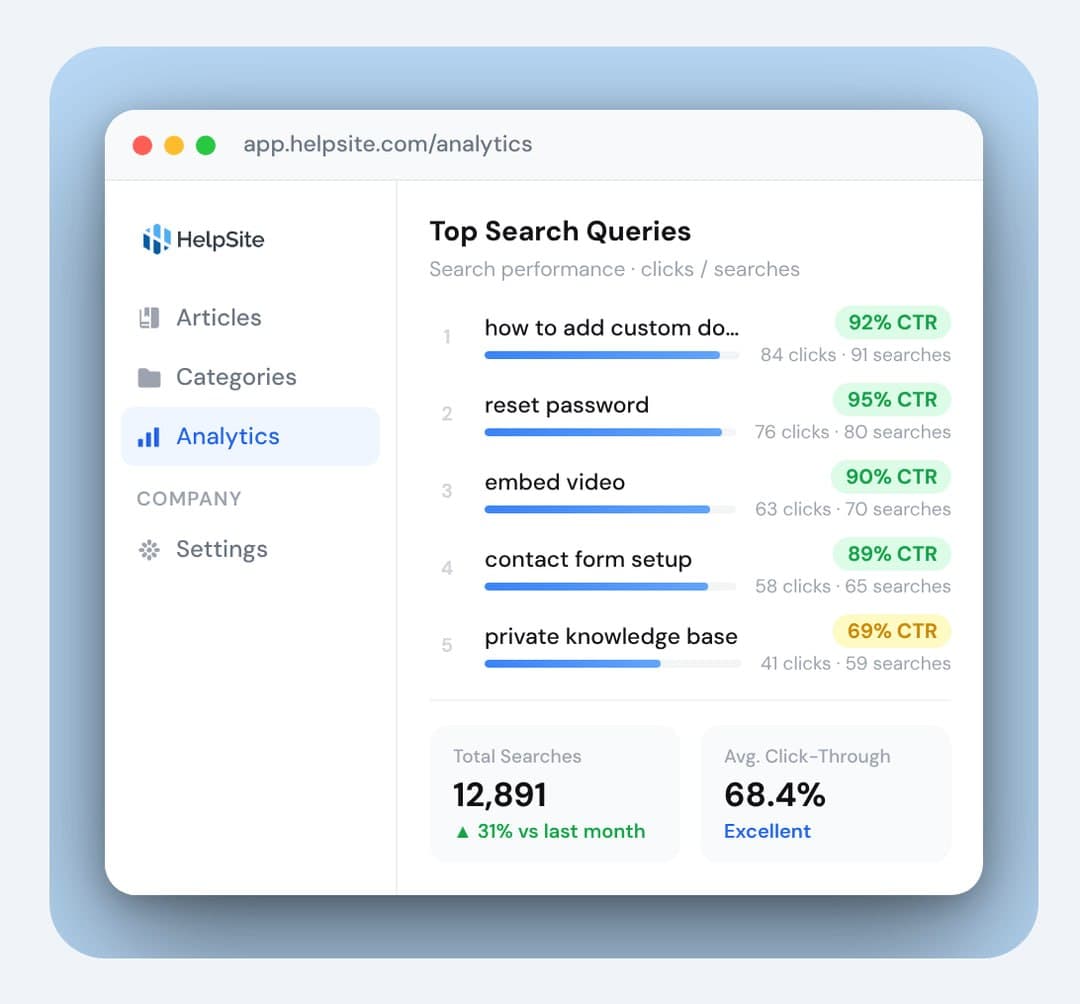
Search insights
Your visitors tell you exactly what they need every time they type in your search bar. HelpSite captures those queries and shows which ones lead to answers and which hit a dead end.
Know what visitors look for most so you can prioritize the content that matters.
Spot searches that return little or nothing—each one is a prompt for a new article.
Let actual visitor behavior, not guesswork, decide what you write next.
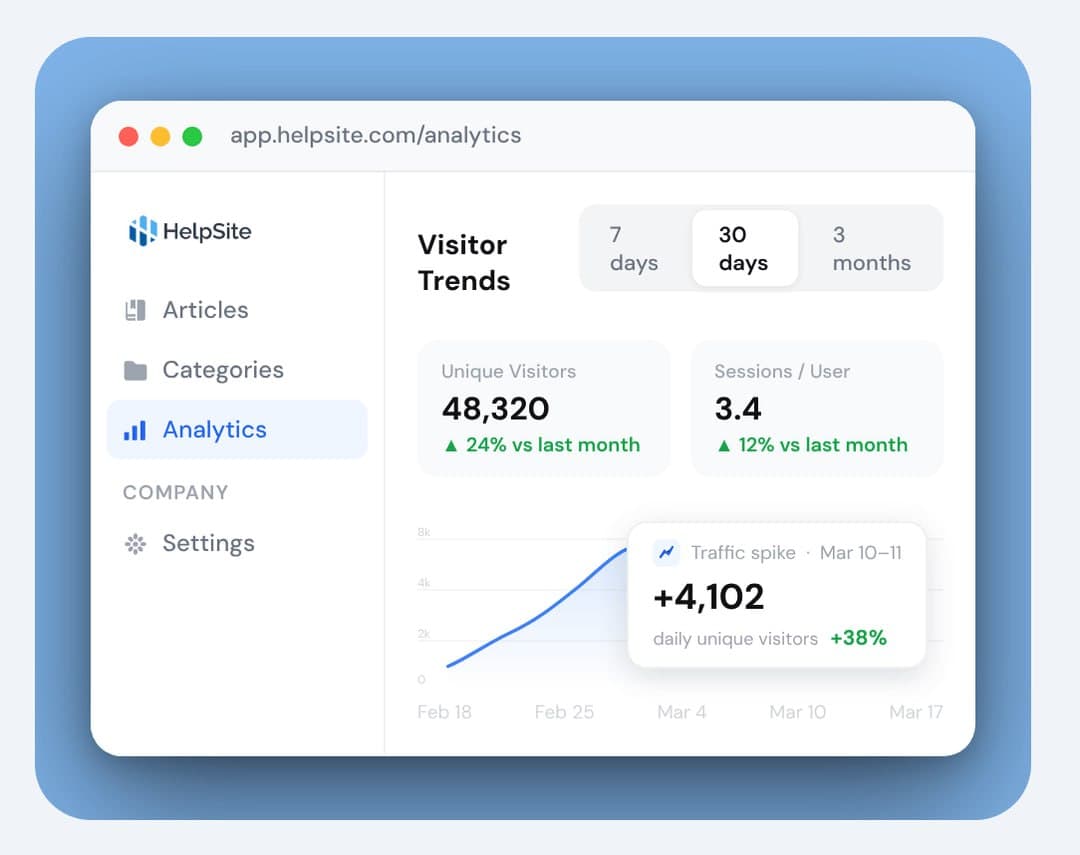
Visitor trends
Filter the whole dashboard to the window you care about and connect spikes to what caused them.
Choose your time range and every metric updates automatically—no reconfiguring.
See the exact days traffic surged and tie them to launches, campaigns, or incidents.
Know how often visitors return—high return rates can signal unresolved questions or active learning.
Launch a help center and start seeing what your visitors actually need—free to try.
Common questions about measuring your help center.
You can track unique visitors and sessions over time, page views and unique visitors per article, top search queries, and traffic trends by date range.
Yes. Article-level reporting shows views and unique visitors per article, and you can sort by views, visitors, or last-updated date.
It surfaces what visitors search for and whether they find answers. Searches with low click-through highlight gaps you can fill with new content.
Yes. Choose a date range and every metric on the dashboard updates to match it automatically.
AI workflows
Connect HelpSite to MCP-compatible AI tools so your team can search, draft, update, and organize docs faster.

AI answers
Answer customer questions with AI grounded in your HelpSite articles, source links, and reviewable chat history.

Ownership
Assign article work, track requests, and keep documentation from becoming one person's invisible job.

Launch a public help center, private SOPs, or both in an afternoon.
Start your free trial